Showing posts with label PowerBI. Show all posts

Sunday, December 02, 2018

Bring XML Data into PowerBI

Here is how to do it.

Launch PowerBI. Click Get Data.

Click XML. Open dialog is displayed. Previously I saved a CD.XML file from W3C site here.


I highlight CD.xml and click Open. Power BI processes my input, and brings up the CD.xml in the Navigator as shown.


I place a check mark for CD.XML. The file loads into the Navigator.


I click Load. My action Load gets processed.


Now CD.XML is loaded into PowerBI. I still don't see it.


 Change it to DataView on the Left. Now you see the data in CD.xml.


That's all folks. Now you can do what you want to do in PowerBI.

Friday, November 30, 2018

Bring TEXT/CSV file data inot PowerBI

It is quite easy as long as you have a good Text/CSV file.

I have previously used this file FFD.txt in earlier posts.


I am going to use the same file in this post.

Launch PowerBI and Click GetData.


Click Text/CSV submenu item. This brings up an 'Open' window as shown which lets you search through your folder system.


 Locate the FFD.txt file on your drive and click Open. The file is displayed in the PowerUI as shown.


Click Load at the bottom of the above.

 The data gets loaded as shown.

Now click on Data in the left as shown and the data is displayed.


This is all folks. It is quite easy to bring in Text/CSV data into PowerBI


Thursday, September 17, 2015

Things you can you learn about Database and Analytics at Visual Studio Live!


If you do manage to attend you can get some new information and brush up on some old stuff. It should be interesting to track the developments.

These are the session details in the Database and Analytics area.

SQL Server of course is center stage. Topics under SQL Server 2014 covers the following:
  • SQL Server Data Tools (SSDT)
  • Reporting Services for Developers
  • Memory-Optimized Tables and Columnstore Indexes in SQL Server 2014
  • Microsoft Azure SQL Database
Topics
TH03 Implementing Data Warehouse Patterns - Attendees Choose
10/01/2015   8:00am - 9:15am
You will learn:
•Techniques for Populating Fact Tables and Dimension tables using T-SQL MERGE statements
•Special considerations for managing Type 2 Slowly Changing dimensions
•Tips for implementing many of the patterns found in the Kimball methodology
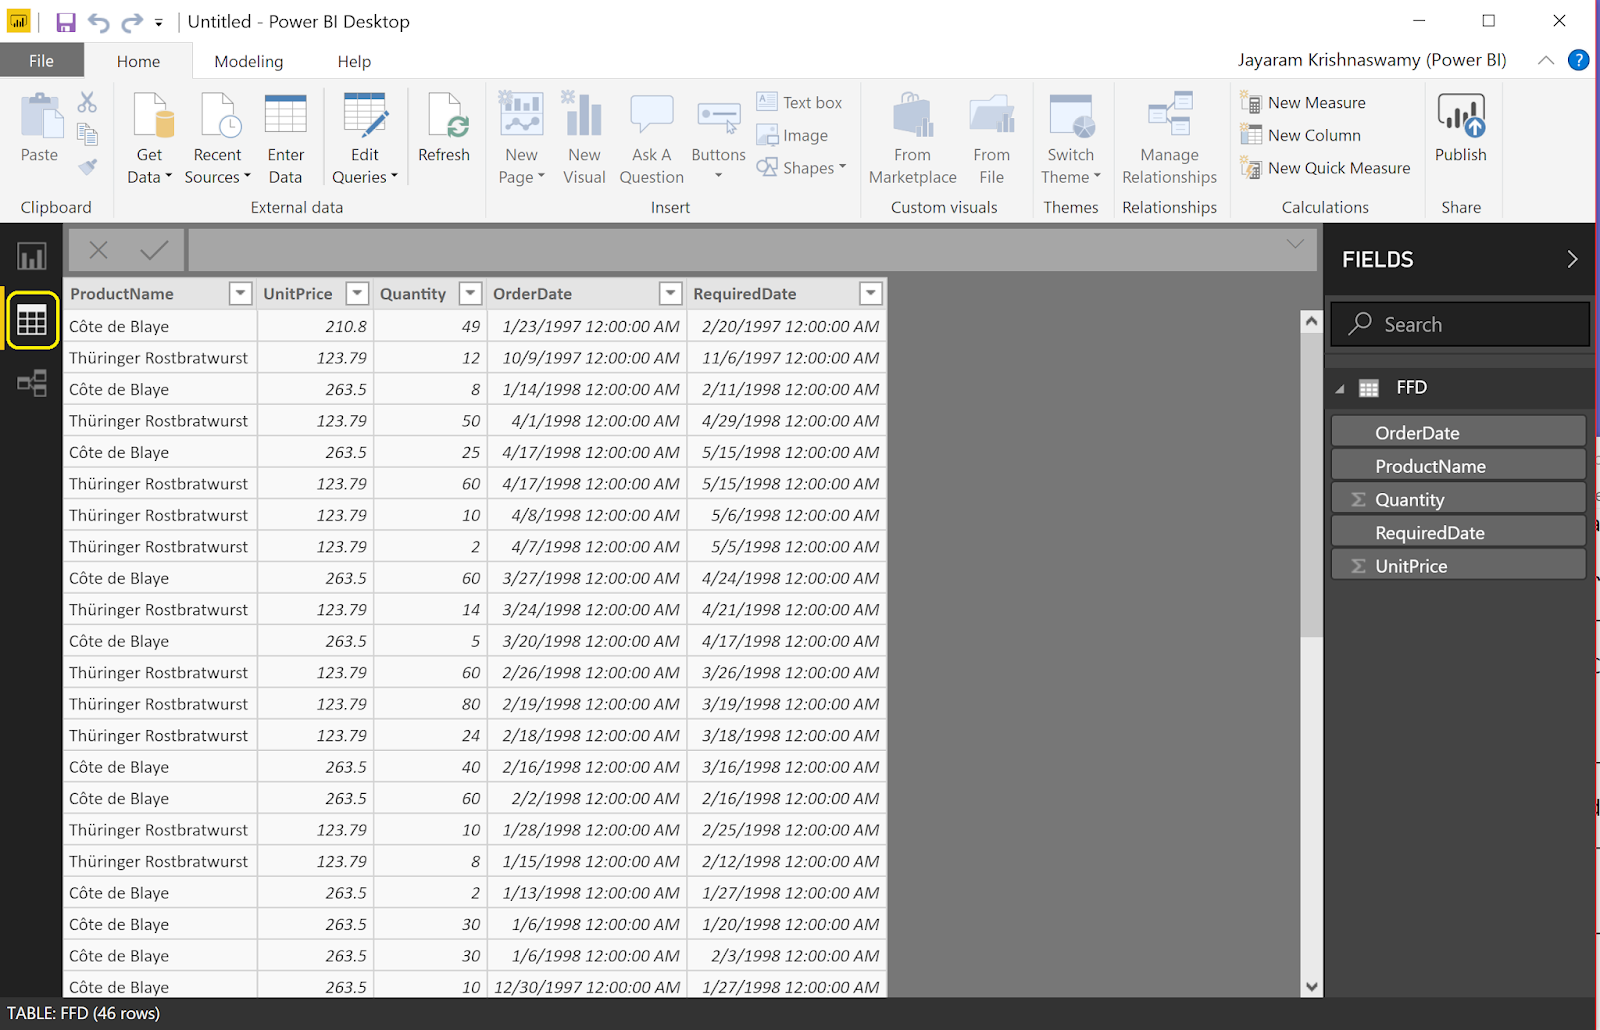
TH07: Power BI 2.0: Analytics in the Cloud and Excel
10/01/2015   9:30am - 10:45am
Get to speed quickly on what Power BI has done since version 1 and what's new in Version
Try to read up on my posts in blogs and you might have already learnt a lot!

TH11: Busy Develoepr's Guide to NoSQL
10/01/2015   11:00am - 12:15pm
You will learn:
•About NoSQLs
•What NoSQLs offer that the RDBMS don't
•When and how (and when not) to use them

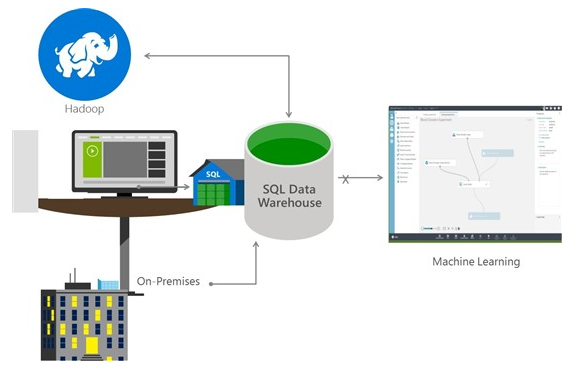
TH15  Big Data and Hadoop with Azure HDInsight
10/01/2015   1:30pm - 2:45pm
 Learn what Hadoop is, how it works, what to do to get it running on the Azure cloud and how to integrate it.
Learn how to integrate it with SQL Server BI, Excel and third party tools

TH19  Predictive Analytics and Azure Machine Learning
10/01/2015   3:00pm - 4:15pm
You will learn:
•Learn the fundamentals of predictive analytics, including which algorithms work best for specific scenarios
•Learn how to build Azure Machine Learning experiments and models
•Get exposed to the R programming language and see how to integrate R code into Azure ML experiments

W19  SQL Server Reporting Services - Attendees Choose Topics
[This presentation takes some of the more complicated topics and offers them as choices that attendees can pick for the session.]
You will learn:
•About advanced SSRS features "in action", as implemented in actual SSRS client applications
•The implementation of mass-automated report delivery of data driven subscriptions in SSRS (and also see .NET code used in SSIS scripts for customized delivery of reports)
•A general understanding of Microsoft's current and future offerings for SSRS in the Cloud

W15  Transact-SQL for Application Developers - Attendees Choose Topics
09/30/2015 3:00pm - 4:15pm
[Attendees choose from 25 possible topics - plus you'll walk away with all 25 code samples.]
You will learn:
•About the new language enhancements in SQL 2012
•Where sub-queries are necessary
•To gain some appreciation of performance optimization

W11  Real World SQL Server Data Tools
09/30/2015   1:30pm - 2:45pm
You will learn:
•Techniques for importing existing legacy SQL Server schemas with old, dead code. Basically, how do you take the kind of messy, not-well-maintained databases that I see at customer sites and bring it into SSDT without losing your sanity and giving up?
•About real enterprise application databases that often have references across database boundaries, and how to identify and variable-ize these database objects and deal with cross-database and cross-SSDT project references.
•How to handle incremental automated deployment scenarios from the command line or TFS Build and manage 'lookup' data as part of these deployment scenarios.

M01  Workshop: Big Data, Analytics and NoSQL: Everything You Wanted to Learn But Were Afraid to Ask
09/28/2015  9:00am - 6:00pm
"Who has time to learn about Big Data, Analytics and NoSQL? "
Perhaps you can learn a little bit of all of the above and more  attending this workshop

Read more here: https://vslive.com/Events/New-York-2015/Tracks/Database-and-Analytics.aspx

Tuesday, September 08, 2015

The need to learn R programming

This post highlights the importance of R programming Language. You also learn where to download it from and install on your workstation or laptop. The installation described here is for a Windows 7 (x64) Toshiba Laptop.

Rforwindows02
It is a language well suited to data analysis and visualization. It is strongly recommended for statistical computing as it is the world's most popular statistical programming language. Since SQL Server 2016 will be integrating with this language we will be seeing a great deal of development in the upcoming SQL Server and of course in PowerBI for analytical data visualization and predictive analytics. Read this white paper from RevolutionAnalytics.

Microsoft bought RevolutionAnalytics in the beginning of this year details of which you can read here. It will be integrated with the up and coming SQL Server 2016.

How and from where you download R language program?

While it is available for Unix/Linux, it is also available for Windows (both x32bit and x64bit). You can download the latest version here (R-3.2.2-win.exe) . The version you will be downloading is R 3.2.2 for Windows (32/64) 62MB. A small file for the complicated things it does.

Here are some download/install screen shots for those who like:

If you are installing for the first time choose that option after you access the download link above.

Rforwindows01
 
The set up for R on Windows needs to be selected:


Rforwindows04

Complete the Installation wizard screens and you are done.

You can invoke it from the desktop shortcut as shown here and the R-GUI will be displayed as shown:

Rforwindows08

Wednesday, August 12, 2015

Take your data with you anywhere you go using this App

This app gives you incredible power. It lets you take your data with you anywhere you go.

You can download this app from the three major stores, Windows Store, Apple's App Store and Google Play which means you can access your data using any mobile device.


1.png

It is free. Just enter an email address and Microsoft will send you a download link, can it be easier than this.


2.png

The email link gives you access to the three stores.

Unfortunately, the Get the app link is not active in Microsoft Edge on my Windows 10 Technical Preview for Phones.

Come back and checck later for an update.

Tuesday, July 28, 2015

Standard setting Microsoft Power BI enters GA

PowerBI 2.0 was released recently (http://blogs.msdn.com/b/powerbi/archive/2015/07/24/power-bi-is-generally-available-today.aspx).  According to the link there appears to be two items, Power BI Service and Power BI Desktop. Power BI Visualization framework and its library will be available on GitHub as well.

Review articles on\using previous version here:

Power BI Unchained
http://hodentek.blogspot.com/2015/02/power-bi-unchained.html
Spin out a cutting edge report with Power BI
http://hodentek.blogspot.com/2015/02/spin-out-cutting-edge-report-with-power.html
Visualizing data on SAP's SQL Anywhere
http://hodentek.blogspot.com/2015/02/powerbi-preview-reporting-from-sql_13.html
Excel data visualization with Power BI
http://hodentek.blogspot.com/2015/02/powerbi-preview-reports-using-data-on.html

Power BI Service: Cloud Hosted Bi and Analytics
Power BI Service download is from this link.
https://powerbi.microsoft.com/?WT.mc_id=Blog_GA_James

I used Sign-in on the above linked page with my personal live.com acccount. It appears you cannot use just your Microsoft account (that anybody can get for free) but the Office 365 or enterprise account.

PowerBI_01

However this did not work for me. I am trying to resolve this issue with Microsoft.
Well, the mantra, 'five seconds to sign up, five minutes to WOW' did not work for me. I shall WOW later.

Installing the Power BI Desktop

Power BI Desktop can be downloaded from here:
https://powerbi.microsoft.com/desktop

Install double clicking the Windows Installer Package PBIDesktop_x64 (55.6MB).


PBIDesk02.png
Agree to licensing terms. Accept default location. After one or more screens page with Install button will be displayed. Click Install. User Control Access window is displayed. Click OK. Progress page is displayed.

PowerBI Desktop is installed quite rapidly.

PBIDesk06.png

A new desktop icon replacing the one from the preview version is created.

Launching the application displays the following window.


PBIDesk07.png

 
Dismiss the start up screen and you will see the Power BI Desktop with the 'ribbon'.

PBIDesk08.png

Happy Visualizing Data!

How does this stack up against Tableau and Qlik?

Review all the data sources from which you can get data for visualization here.


Sunday, June 28, 2015

Azure SQL Data Warehouse Service is now in public preview

Following on the heels of April's Build Conference Microsoft has announced the enterprise-class elastic data warehouse as a service- the Azure SQL Data Warehouse available for public preview.

 The driving forces are of course the super elasticity and cost effectiveness. If you have already invested in Azure cloud you have at your disposal Azure related tools, utilities and skills.
Azure SQL Data Warehouse Service is based on massive, parallel processing architecture and integrates with PowerBI and Azure Machine Learning for advanced analytics. It also integrates with Azure Data Factory for event processing and its big data offering, the Azure HD Insight.

Here is the big picture:

Tuesday, March 17, 2015

Microsoft Azure IoT Services update

At Convergence 2015 in Atlanta, GA Microsoft outlined Microsoft's vision of IoT on 16th March. Convergence is actually showcasing of Microsoft Dynamics CRM products but as PowrBI is very much a part of IoT a large part of the talk from the CEO was on 'Azure IoT Suite' and how Windows 10 will play out in IoT.

Here is the complete Azure IoT Services suite, some production worthy(almost) and others in preview:
Preview Stage-Likely to enter GA stage next month
  • Azure DocumentDB
  • Azure Stream Analytics
  • Azure Machine Learning
  • Power BI
In general availability(GA)stage
  • Azure Notification Hubs
  • Azure HDInsight
  • Azure Event Hubs
Then there is the 'Azure Intelligent Systems Service' consisting of:
  • PowerBI
  • HD Insight-Microsoft's Big Data Offering via Microsoft's Hadoop which is later expected to debut as a comprehensive  Azure IoT Suite
Here you can find lot more details on most of the above:

DocumentDB
http://hodentek.blogspot.com/2014/08/nosql-azure-service-documentdb-as.html
http://hodentek.blogspot.com/2014/08/how-do-you-sign-up-for-azure-documentdb.html
http://hodentek.blogspot.com/2014/08/getting-to-know-documentdb.html
http://hodentek.blogspot.com/2014/08/getting-to-know-documentdb-part-2.html

Machine Learning
http://hodentek.blogspot.com/2014/07/azure-ml-predictive-analytics-as.html

Hadoop:
http://hodentek.blogspot.com/2014/02/windows-azure-managment-improvements-in.html

PowerBI
http://hodentek.blogspot.com/2015/02/power-bi-unchained.html
http://hodentek.blogspot.com/2015/02/spin-out-cutting-edge-report-with-power.html
http://hodentek.blogspot.com/2015/02/powerbi-preview-reporting-from-sql_13.html
http://hodentek.blogspot.com/2015/02/powerbi-preview-reporting-from-sql.html
http://hodentek.blogspot.com/2015/02/powerbi-preview-reports-using-data-on.html

Azure Event Hubs:
http://hodentek.blogspot.com/2014/11/move-towards-large-scale-azure-adoption.html 

Sunday, February 22, 2015

BI projects in SQL Server Data Tools

SQL Server  Data Tools(SSDT) installs when you install SQL Server 2012 (even the SQL Server 2012 Express edition). SSDT has all the necessary project templates to start a Business Intelligence project. However it will not have the templates for other language projects such as C#, VB.NET etc.

SSDT allows you to create all the Business Intelligence related projects by providing templates for the projects. You can also create SQL Server projects as shown here:


ssisProj03
Here is an example of creating a SQL Server Integration Services project using the Visual Studio Shell launched by SSDT that gets installed with the SQL Server.

http://hodentekmsss.blogspot.com/2015/02/sql-server-data-toolsssdt-installs-when.html

More posts on SSDT here:
http://hodentek.blogspot.com/2013/10/ssdt-bi-templates-for-sql-server-2012.html

http://hodentek.blogspot.com/2014/07/new-update-to-sql-server-data-tools.html

http://hodentek.blogspot.com/2014/03/sql-server-data-tools-to-go-with-sql.html

Sunday, February 15, 2015

PowerBI Preview reports using data on an EXCEL file

Excel is a well known number cruncher and a super hero of Self-Service BI while PowerBI is an easy to use interface for turning out eye catching, cutting edge reports. PowerBI is still in preview.

This post describes visualization report creation using PowerBI previewon a Windows 8.1 machine which does not have Office installed.

This starts of from an MS Excel  file that was created using the Export-Import Wizard and the AdventureWorks2012 database on an instance of SQL Server 2012 running on a Windows 8.1 laptop. If you want to know how AdvTest.xls was created follow this link:
http://hodentekmsss.blogspot.com/2015/02/exporting-data-from-sql-server-2012-to.html

The screen shots shown here may not be step-by-step. Please review by previous posts on this topic:

http://hodentek.blogspot.com/2015/02/spin-out-cutting-edge-report-with-power.html

http://hodentek.blogspot.com/2015/02/powerbi-preview-reporting-from-sql.html

http://hodentek.blogspot.com/2015/02/powerbi-preview-reporting-from-sql_13.html

http://hodentekmsss.blogspot.com/2015/02/authoring-report-with-power-bi-using.html

When PowerBI is launched and Get Data for an Excel application is clicked you will get the following displayed:

Excel22
 
For some reason I am not able to explain presently, PowerBI seems to duplicate the entries here for each of the tables on the SQL Server. Perhaps this will go away in the release version.
 
When I tried to load three of the chosen tables, the program cranks to load as shown:
 

Excel24
 
However it does not load and comes up with this excuse:


Excel11
If you over come this objection then you can load the table/tables as shown. The designers could have imagined this scenario and provided a direct link if not a download and install of required file.
 
This was the table (vSalesPerson) loaded to create the report. The Excel file (AdvTest.xls) had all these columns in several sheets in the workbook.
 
vSalesPerson
BusinessEntityID
Title
FirstName
MiddleName
LastName
Suffix
JobTitle
PhoneNumber
EmailAddress
AddressLine1
AddressLine2
City
StateProvinceName
PostalCode
CountryRegionName
TerritoryName
TerritoryGroup
SalesQuota
SalesYTD
SalesLastYear
 
To create a report few of the columns in the table was used. Here is a Card Type report created using this table exported to Excel File "AdvTest.xls".
 
 
Excel29

The columns chosen for the visualized report are shown on the right presently highlighted. They are just numbered column names that must be associated with the list of fields shown earlier. However the visualized report shows the names correctly.
 
Something the designers could have done easily was during loading of the file they should have brought in the original column names and not the numbered columns as shown here.  Also in the visualized report the column name appears as one of the cards (3r or 4th) in the above report.
Another feature that (perhaps I missed this time) perplexed me was how to move the fields to the Vertical and Horizontal axes. The drag and drop did not work.
I could list out few more problems but considering the fact it is in preview things can only get better.
 
Namaste

p.s: One of the screen shots was replaced with the correct on
 

Friday, February 13, 2015

PowerBI Preview reporting from SQL Anywhere 16 - Part 2

Connection problem mentioned  in the previous post:
PowerBI Preview reporting from SQL Anywhere 16 - Part 1
was resolved.

This post describes the correct way of making a connection to SQL Anywhere 16 from Power BI and generating a report from a View on the server.

If this is the first time you land on this page, please review the following post that describes the step-by-step process:
 http://hodentekmsss.blogspot.com/2015/02/authoring-report-with-power-bi-using.html

Make sure the SQL Anywhere 16 network server has started. After launching PowerBI and hitting the Get Data link the following screen will be displayed:


sybase3

Click connect to connect to the SQL Anywhere 16 server running on your laptop. The following screen is displayed.


Sybase17

Enter Server and Database name as shown. You can read this from the server startup screen superimposed.

Click OK on this screen. The following screen is displayed. If instead of this you may get an authentication window. In which case choose 'Database' login and use the sql/dba pair for authentication.


Sybase18

You may recognize these as the tables on the 'Demo' database on the samples provided by Sybase (SAP).

By default only the tables are displayed. In order to display views you may have to search for them. Review this screen from Sybase Central connected to the same server.

Sybase19

There is a  View called ViewSalesOrders. Insert this in the search box and click search. The ViewSearchOrders data will be displayed as shown.
Sybase20

Clock Load and load the data to the BI Designer. Perhaps this data may not be the greatest data ti mine, but let us go ahead and see. The data gets loaded to the mode as shown.

As shown in my previous post choose the items to be included in your report as shown on the right extreme of the next image which shows all the fields contained in the View. The report gets generated in no time at all. All that was done was to choose the fields. it cannot get any dumber!

 
Sybase21
 
That is all folks! Namaste


Wednesday, February 11, 2015

PowerBI Preview reporting from SQL Anywhere 16 - Part 1

This post describes the steps you may take to connect to SQL Anywhere 16's 'demo' server. Previously you have seen that it is possible to create a linked server successfully using the drivers provided with SQL Anywhere 16.

http://hodentek.blogspot.com/2014/07/use-sybasesaps-sql-anywhere-ole-db.html
http://hodentekmsss.blogspot.com/2014/07/creating-linked-server-to-sapsybase-sql.html

In a future article here are on my other blog, http://hodnetekMSSS.blogspot.com  you will learn how to use PowerPivot to connect to SQL Anywhere 16.

Here are some screen shots of PowerBI  connecting  to SQL Anywhere.
Before you start connecting make sure you have started the SqlAnywhere 16 server successfully and also Sybase Central to verify that you can access the objects.


If you have followed my earlier article here:
http://hodentekmsss.blogspot.com/2015/02/authoring-report-with-power-bi-using.html

You will notice that PowerBI can obtain its data from a Sybase Database as(I am assuming that SQL Anywhere 16 is a Sybase database) shown
Sybase3

Choose Sybase Database and click Connect button. The following screen will be displayed


I have superposed the server start up screen on the PowerBI's screen. The server name is demo16. This server takes the pair dba/sql as username and password for connection, a database authentication.

When I complete the database name 'demo' and click Ok on the PowerBI's Sybase Database page, the following will be displayed:
'
Sybase6

I enter the authentication information (dba/sql) and click Connect, the following will be displayed

sybase7
Looks like the program is looking for an IP Address.  Since the server is running on the local computer the IP address should be the same as the computer's IP address. Also from Sybase Central 16 you find the following:

Sybase8

Every connection turns up in a Query in PowerBI and you can delete the query to connect to a new connection. Following the above reasoning the following connection was tried:

sybase9

After clicking OK the following was displayed.


sybase10
However trying to connect produces the following:


sybase16

It appears that there is a connectivity problem via PowerBI where as ODBC Ole DB seems to work as well as ODBC drivers. The PowerBI program certainly needs enhancements in terms of allowing ODBC and OLE DB drivers in addition to the vendor products.  Also the interactive screens should provide a gateway for a solution rather than a hard stop.

I am sure these will improve in the final version. In the mean time if I find a work around you may find it on this blog should you revisit.
DMCA.com Protection Status