Excel is a well known number cruncher and a super hero of Self-Service BI while PowerBI is an easy to use interface for turning out eye catching, cutting edge reports. PowerBI is still in preview.
This post describes visualization report creation using PowerBI previewon a Windows 8.1 machine which does not have Office installed.
This starts of from an MS Excel file that was created using the Export-Import Wizard and the AdventureWorks2012 database on an instance of SQL Server 2012 running on a Windows 8.1 laptop. If you want to know how AdvTest.xls was created follow this link:
http://hodentekmsss.blogspot.com/2015/02/exporting-data-from-sql-server-2012-to.html
The screen shots shown here may not be step-by-step. Please review by previous posts on this topic:
http://hodentek.blogspot.com/2015/02/spin-out-cutting-edge-report-with-power.html
http://hodentek.blogspot.com/2015/02/powerbi-preview-reporting-from-sql.html
http://hodentek.blogspot.com/2015/02/powerbi-preview-reporting-from-sql_13.html
http://hodentekmsss.blogspot.com/2015/02/authoring-report-with-power-bi-using.html
When PowerBI is launched and Get Data for an Excel application is clicked you will get the following displayed:


 Excel11
Title
FirstName
MiddleName
LastName
Suffix
JobTitle
PhoneNumber
EmailAddress
AddressLine1
AddressLine2
City
StateProvinceName
PostalCode
CountryRegionName
TerritoryName
TerritoryGroup
SalesQuota
SalesYTD
SalesLastYear
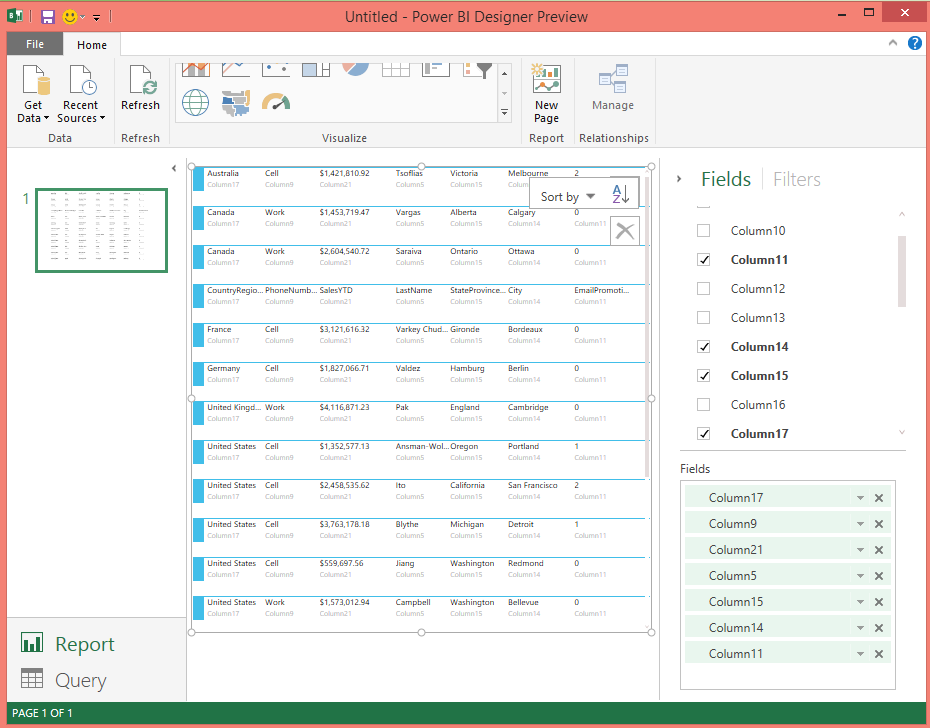
The columns chosen for the visualized report are shown on the right presently highlighted. They are just numbered column names that must be associated with the list of fields shown earlier. However the visualized report shows the names correctly.
p.s: One of the screen shots was replaced with the correct on
This post describes visualization report creation using PowerBI previewon a Windows 8.1 machine which does not have Office installed.
This starts of from an MS Excel file that was created using the Export-Import Wizard and the AdventureWorks2012 database on an instance of SQL Server 2012 running on a Windows 8.1 laptop. If you want to know how AdvTest.xls was created follow this link:
http://hodentekmsss.blogspot.com/2015/02/exporting-data-from-sql-server-2012-to.html
The screen shots shown here may not be step-by-step. Please review by previous posts on this topic:
http://hodentek.blogspot.com/2015/02/spin-out-cutting-edge-report-with-power.html
http://hodentek.blogspot.com/2015/02/powerbi-preview-reporting-from-sql.html
http://hodentek.blogspot.com/2015/02/powerbi-preview-reporting-from-sql_13.html
http://hodentekmsss.blogspot.com/2015/02/authoring-report-with-power-bi-using.html
When PowerBI is launched and Get Data for an Excel application is clicked you will get the following displayed:

Excel22
For some reason I am not able to explain presently, PowerBI seems to duplicate the entries here for each of the tables on the SQL Server. Perhaps this will go away in the release version.
When I tried to load three of the chosen tables, the program cranks to load as shown:

Excel24
However it does not load and comes up with this excuse:
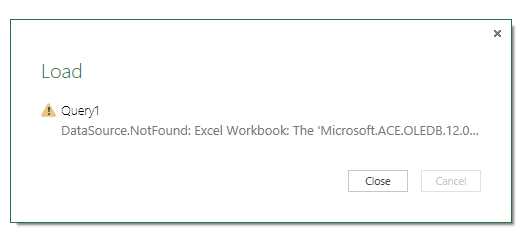
If you over come this objection then you can load the table/tables as shown. The designers could have imagined this scenario and provided a direct link if not a download and install of required file.
This was the table (vSalesPerson) loaded to create the report. The Excel file (AdvTest.xls) had all these columns in several sheets in the workbook.
vSalesPerson
BusinessEntityIDTitle
FirstName
MiddleName
LastName
Suffix
JobTitle
PhoneNumber
EmailAddress
AddressLine1
AddressLine2
City
StateProvinceName
PostalCode
CountryRegionName
TerritoryName
TerritoryGroup
SalesQuota
SalesYTD
SalesLastYear
To create a report few of the columns in the table was used. Here is a Card Type report created using this table exported to Excel File "AdvTest.xls".

Excel29
Something the designers could have done easily was during loading of the file they should have brought in the original column names and not the numbered columns as shown here. Also in the visualized report the column name appears as one of the cards (3r or 4th) in the above report.
Another feature that (perhaps I missed this time) perplexed me was how to move the fields to the Vertical and Horizontal axes. The drag and drop did not work.
I could list out few more problems but considering the fact it is in preview things can only get better.
Namaste
p.s: One of the screen shots was replaced with the correct on

No comments:
Post a Comment