I visited the Tableau Software booth at TechNet Asia-Pacific 2014 and I was quite impressed with the Tableau products (and the various data sources that can be used): Tableau for Desktop; Tableau Server; and Tableau on line which provides Business Intelligence in the cloud.

I just wanted to take a look at their Tableau on line and visited their trial page here:
http://www.tableausoftware.com/products/trial
The first step is you need to register to get in. After registering you can request for a trial use of the Tableau Desktop software. Following this you will get the software suitable for your architecture. On my Windows 8.1 I got the x64bit version of the software (TableauDesktop,msi 124MB).
You can double click the msi file at the download location. At the welcome screen accept the license terms after viewing the same. The version you will be installing is 8.3 (Actually you get the 8.2 version as I found out while using the trial software).

After registration you can start using the software. I just used the trial to see how easy; how intuitive and how difficult to use.
When launched the first window to display is a workbook called Book1 as shown.

It opens in the Workbooks view with Data on the left and a number of Sample Workbooks at the footer (bottom) as shown above.
You can connect to a data source or you can connect to saved data sources, some of them from Excel, some from Access and other from Tableau data. If you are just exploring you have option to watch the product tour or the training videos.
The menu is simple enough for this view with File, Data, Server and Help. The Help menu offers the following:

Let us just explore the World Indicators sample. Click on this sample at the bottom of the screen. The processing request get sent to the data source and this is what you will see. This is read-only.

It has the classic look of analytical software with Measures, Dimensions, Filters etc. You are looking at the bar graph of 2010 GDP Per Capita by country.
Let us modify the filter. Right click on Region to display the regions from which you can choose.

Clicking on Filter brings up the Filter[Region] tabbed pane as shown.
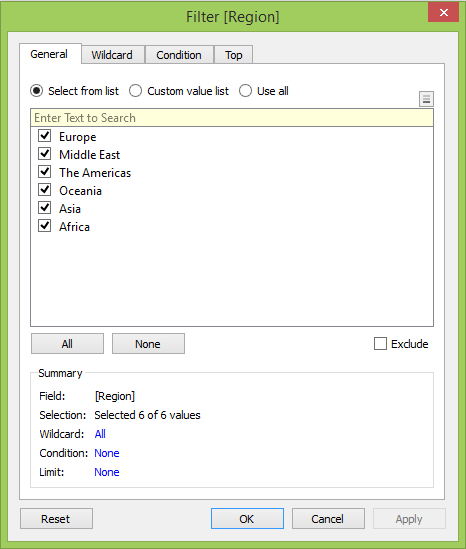
Let us remove all but Asia ; click apply and click OK.
The UI changes to the following:

Right click on Country/Region on Rows to display a finer filtering as shown.
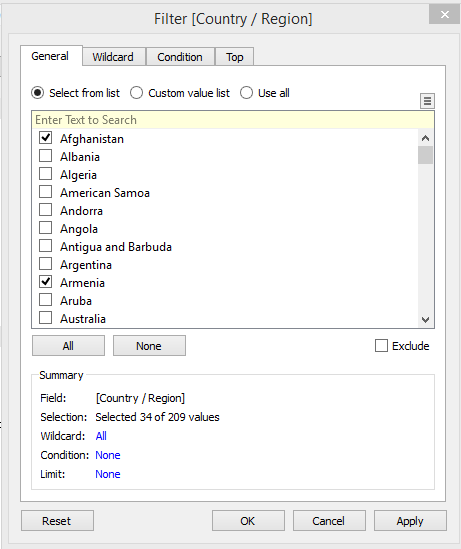 Go ahead and choose India and China (first choose none to remove all check marks and then choose India and China). Click Apply and then OK. The UI changes to the following:

Let us say you want to include data for more years (right now only 2010). Right click on YEAR(Date..) under Filters and choose from 2000 to 2005. The picture changes to the following:

You also have some associated information at the bottm of the page.

Click on Country Ranks and you would get a whole lot of information from all the countries in the database.

By dragging the slider in the Year pane you can compare how things changes with time.
In the Show Me window you can choose the chart type and chart features . The next image shows the bubble chart for the same data.

This post has only shown some simple features that you can look up using the sample book that comes with the software and I am sure it is lot more sophisticated than described here. Of course all this is based on crating a model which you can do in Tableau.
For connecting to SQL Server 2012 from Tableau please visit my other blog in a day or two:
http://hodentekMSSS.blogspot.com

I just wanted to take a look at their Tableau on line and visited their trial page here:
http://www.tableausoftware.com/products/trial
The first step is you need to register to get in. After registering you can request for a trial use of the Tableau Desktop software. Following this you will get the software suitable for your architecture. On my Windows 8.1 I got the x64bit version of the software (TableauDesktop,msi 124MB).
You can double click the msi file at the download location. At the welcome screen accept the license terms after viewing the same. The version you will be installing is 8.3 (Actually you get the 8.2 version as I found out while using the trial software).

After registration you can start using the software. I just used the trial to see how easy; how intuitive and how difficult to use.
When launched the first window to display is a workbook called Book1 as shown.

It opens in the Workbooks view with Data on the left and a number of Sample Workbooks at the footer (bottom) as shown above.
You can connect to a data source or you can connect to saved data sources, some of them from Excel, some from Access and other from Tableau data. If you are just exploring you have option to watch the product tour or the training videos.
The menu is simple enough for this view with File, Data, Server and Help. The Help menu offers the following:

Let us just explore the World Indicators sample. Click on this sample at the bottom of the screen. The processing request get sent to the data source and this is what you will see. This is read-only.

It has the classic look of analytical software with Measures, Dimensions, Filters etc. You are looking at the bar graph of 2010 GDP Per Capita by country.
Let us modify the filter. Right click on Region to display the regions from which you can choose.

Clicking on Filter brings up the Filter[Region] tabbed pane as shown.

Let us remove all but Asia ; click apply and click OK.
The UI changes to the following:

Right click on Country/Region on Rows to display a finer filtering as shown.


Let us say you want to include data for more years (right now only 2010). Right click on YEAR(Date..) under Filters and choose from 2000 to 2005. The picture changes to the following:

You also have some associated information at the bottm of the page.
Click on Country Ranks and you would get a whole lot of information from all the countries in the database.

By dragging the slider in the Year pane you can compare how things changes with time.

This post has only shown some simple features that you can look up using the sample book that comes with the software and I am sure it is lot more sophisticated than described here. Of course all this is based on crating a model which you can do in Tableau.
For connecting to SQL Server 2012 from Tableau please visit my other blog in a day or two:
http://hodentekMSSS.blogspot.com