This is the easiest way to work on your stock holdings using Excel. The stock data type is awesome. Just one entry in a cell gives everything you want to know about your stock. You can build applications with it, but I will show you how to do it in three simple steps.
Step 1. Open a cell and enable it for stock data type using the Data menu.
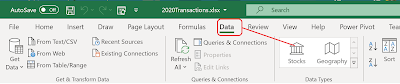


Step 1. Open a cell and enable it for stock data type using the Data menu.

Step 2: Open a cell or cells (I am just showing ROKU in one cell). You can type in stock ticker symbols in any number of rows in the same column. Highlight the column each row of which contains a ticker symbol and click Stocks in the Data Menu. By the way, I just typed ROKU and it changes to Roku Inc.(XNAS:ROKU)

Step 3: Now you pick the items you want to see in the little icon with a + in green. I choose Price (scrolling down this list) and in the adjoining column the current price will be displayed. You can see other items like 52 Week high, 52 Week low, Industry, etc.

I have added 5% down, 15% down, etc. if you are interested in using it for trading. I could also have a link to my investment account and trade as easily.

No comments:
Post a Comment