Extracting intelligence from Sensors of all kinds starts with collecting raw data from the sensors. This is followed by processing of some kind. In Microsoft Azure sensor data is moved to blob storage (Azure Data Tier) and then to the HDInsight Hive tables. Once data is in the tables one can connect these tables to Microsoft Excel using Hive ODBC Drivers. Once there one use the powerful BI features including PoweView. You can now visualize data from the sensors.

SensorDataHadoopAzure.png
The first step in implementing sensor data visualization is to use the HDInsight service on Microsoft Azure. Of course you need to have a Azure subscription even before that. logging on to Windows Azure you can get started with your HiveInsight as shown here:

SensorDataHadoopAzure_2.png
You can click on HDInsight to begin creating a HDInsight cluster as shown:
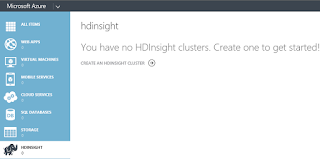
SensorDataHadoopAzure_3.png
HDInsight is a compute cluster that uses Apache Hadoop.
 HDInsightCluster.png
Click on Create a HDInsight Cluster in Microsoft Azure to open the following dialog:
 SensorDataHadoopAzure_4.png
As you can see that before you can create a clusteer you need know where you are placing the raw data from sensor. This means you require a storage account before you create a cluster. As there is a lot of support for 3rd parties and Open Source the clusters can also be created on Linux, but this is still in preview (probably will change).
 As the cluster storage of this kind is only possible at selected data centers you should create the Azure Blob storage at one of those centers.
SensorDataHadoopAzure_5
to be continued..

SensorDataHadoopAzure.png
The first step in implementing sensor data visualization is to use the HDInsight service on Microsoft Azure. Of course you need to have a Azure subscription even before that. logging on to Windows Azure you can get started with your HiveInsight as shown here:

SensorDataHadoopAzure_2.png
You can click on HDInsight to begin creating a HDInsight cluster as shown:

SensorDataHadoopAzure_3.png
HDInsight is a compute cluster that uses Apache Hadoop.

Click on Create a HDInsight Cluster in Microsoft Azure to open the following dialog:

As you can see that before you can create a clusteer you need know where you are placing the raw data from sensor. This means you require a storage account before you create a cluster. As there is a lot of support for 3rd parties and Open Source the clusters can also be created on Linux, but this is still in preview (probably will change).

SensorDataHadoopAzure_5
to be continued..

No comments:
Post a Comment