Showing posts with label Data Visualization. Show all posts

Sunday, April 24, 2016

Dataiku Data Science Studio (DSS) now available as image on Microsoft Azure

Dataiku DSS allows data professionals to prototype, build and deploy specific services to transform raw data for Prediction or otherwise.

Once you have the data on Azure you can use DSS's web interface to load and prepare data in a visual interface; analyze and visualize data; and train machine algorithms to model your project. The resulting model can be finally automated to run entire workflow.

The pre-built image is now available on Azure, but you may need to go to the Azure's new portal here,

or get started from here.


Features that you may interested in:
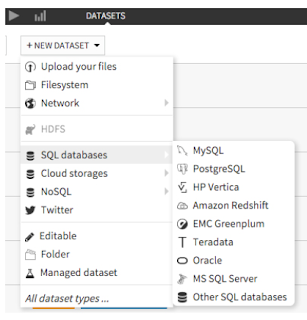
  • Connectivity: Connect to more than 25 data storage systems
  • Data Wrangling: Interactive data cleaning and enrichment
  • Machine Learning: Step-by-step guided machine learning
  • Data Mining : Immediate visual insights
  • Data Visualization: Histogram, maps, scatter plots, heat maps, boxplots, and so much more.
    Easily build visualisations and explore your data with drag and drop functionalities.
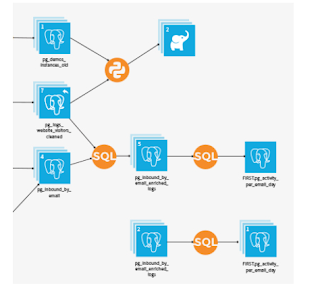
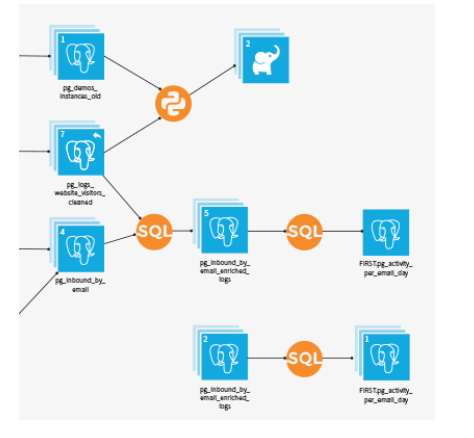
    -DSS automatically computes charts on your existing Big Data infrastructure (SQL or Impala) for optimal performance.
  • Data Workflow: Visualize and re-run Workflows
  • Real-time Scoring: Go from design to production, instantaneously

Other features of importance:

Collaboration: Integrated documentation and knowledge sharing
Deployment: Deploy workflows using staged deployment models
Enterprise readiness: Data governance and fine grained data access and integration with Hadoop

Watch this video from Dataiku here:

Wednesday, December 16, 2015

One stop agile BI with Sisense


Analytics on complex data made easy.
You do not need extensive IT resources to get meaning out of complex data. Sisense uses an In-Chip engine.

Main features extracted from Sisense site :

  • It is a single stack software-single tool to analyze and visualize, save on data warehouse costs
  • Shortest time from complex data to dashboard visualization
  • Short learning curve
  • Join tables from different sources on the fly
  • No need to prepare data, just jump to analysis and visualization
  • In-Chip engine optimize resource removing hardware and software stacks
  • Sorry DBAs, you are not needed
  • Unmatched TCO
  • Scaling to Terabytes, OK
Sisense Users


Watch this video:


Tuesday, September 08, 2015

The need to learn R programming

This post highlights the importance of R programming Language. You also learn where to download it from and install on your workstation or laptop. The installation described here is for a Windows 7 (x64) Toshiba Laptop.

Rforwindows02
It is a language well suited to data analysis and visualization. It is strongly recommended for statistical computing as it is the world's most popular statistical programming language. Since SQL Server 2016 will be integrating with this language we will be seeing a great deal of development in the upcoming SQL Server and of course in PowerBI for analytical data visualization and predictive analytics. Read this white paper from RevolutionAnalytics.

Microsoft bought RevolutionAnalytics in the beginning of this year details of which you can read here. It will be integrated with the up and coming SQL Server 2016.

How and from where you download R language program?

While it is available for Unix/Linux, it is also available for Windows (both x32bit and x64bit). You can download the latest version here (R-3.2.2-win.exe) . The version you will be downloading is R 3.2.2 for Windows (32/64) 62MB. A small file for the complicated things it does.

Here are some download/install screen shots for those who like:

If you are installing for the first time choose that option after you access the download link above.

Rforwindows01
 
The set up for R on Windows needs to be selected:


Rforwindows04

Complete the Installation wizard screens and you are done.

You can invoke it from the desktop shortcut as shown here and the R-GUI will be displayed as shown:

Rforwindows08

Monday, December 15, 2014

Tableau Software for Rapid fire BI

I visited the Tableau Software booth at TechNet Asia-Pacific 2014 and I was quite impressed with the Tableau products (and the various data sources that can be used): Tableau for Desktop; Tableau Server; and Tableau on line which provides Business Intelligence in the cloud.


I just wanted to take a look at their Tableau on line and visited their trial page here:
http://www.tableausoftware.com/products/trial

The first step is you need to register to get in. After registering you can request for a trial use of the Tableau Desktop software. Following this you will get the software suitable for your architecture. On my Windows 8.1 I got the x64bit version of the software (TableauDesktop,msi 124MB).
You can double click the msi file at the download location. At the welcome screen accept the license terms after viewing the same. The version you will be installing is 8.3 (Actually you get the 8.2 version as I found out while using the trial software).


After registration you can start using the software. I just used the trial to see how easy; how intuitive and how difficult to use.
When launched the first window to display is a workbook called Book1 as shown.


It opens in the Workbooks view with Data on the left and a number of Sample Workbooks at the footer (bottom) as shown above.

You can connect to a data source or you can connect to saved data sources, some of them from Excel, some from Access and other from Tableau data. If you are just exploring you have option to watch the product tour or the training videos.

The menu is simple enough for this view with File, Data, Server and Help. The Help menu offers the following:

Let us just explore the World Indicators sample. Click on this sample at the bottom of the screen. The processing request get sent to the data source and this is what you will see. This is read-only.


It has the classic look of analytical software with Measures, Dimensions, Filters etc. You are looking at the bar graph of 2010 GDP Per Capita by country.

Let us modify the filter. Right click on Region to display the regions from which you can choose.


Clicking on Filter brings up the Filter[Region] tabbed pane as shown.


Let us remove all but Asia ; click apply and click OK.
The UI changes to the following:


Right click on Country/Region on Rows to display a finer filtering as shown.

Go ahead and choose India and China (first choose none to remove all check marks and then choose India and China). Click Apply and then OK. The UI changes to the following:


Let us say you want to include data for  more years (right now only 2010). Right click on YEAR(Date..) under Filters and choose from 2000 to 2005. The picture changes to the following:


You also have some associated information at the bottm of the page.


Click on Country Ranks and you would get a whole lot of information from all the countries in the database.


By dragging the slider in the Year pane you can compare how things changes with time.

In the Show Me window you can choose the chart type and chart features . The next image shows the bubble chart for the same data.


 This post has only shown some simple features that you can look up using the sample book that comes with the software and I am sure it is lot more sophisticated than described here. Of course all this is based on crating a model which you can do in Tableau.

For connecting to SQL Server 2012 from Tableau please visit my other blog in a day or two:
http://hodentekMSSS.blogspot.com

Sunday, January 17, 2010

New Data Visualization options in Report Builder 3.0

In my book 'Learning SQL Server Reporting Services 2008' I dealt mostly with reports that can be authored using Report Buidler 2.0.

A complete chapter from the book on Report Builder 2.0 is freely available at the two following links:

Learning SQL Server Reporting Services 2009 - Part 1
Learning SQL Server Reporting Services 2009 - Part 2

Together with SQL Server 2008 R2 Nov-CTP Microsoft released a new Report Builder, Microsoft SQL Server 2008 R2 November CTP Report Builder 3.0 which is available as a standalone download from this location.
It can be installed using either wizards or from the commandline. You could also choose to configure it to work with a report server in native mode, or with a report server running in integrated Sharepoint mode.

I took a first look at it installing in native mode to my SQL Server 2008 R2 NoV-CTP Hodentek3\Kumori. When I open the Report Builder 3's UI, I see a number of data visualization options that were not available in Report Builder 2.0.

Here is a screen shot of the UI with the new items. In addition to Charts and Gauges, there are several other interesting options.

DMCA.com Protection Status